
Multi-site analysis · Remote sensing · AI-powered
BeeOimpact
Prioritise your sites. Assess the impacts and dependencies of your activities. Understand the state of local biodiversity. Report at low cost — across your entire portfolio, in minutes.
Why BeeOimpact
Four reasons it creates business value.
What you get
Concrete outputs you can act on.
Data
Site prioritisation
Risk score per site based on sensitive area proximity, protected species, pollinator score, pesticide pressure and more
Automated ranking across your full portfolio
Impact & dependency assessment
Potential impacts and dependencies of your activities on local biodiversity and ecosystem services — informed by NACE code and landscape context
State of local biodiversity
Ecosystem type and condition, habitat status, threatened and invasive species, land use cover — actionable data to guide on-the-ground decisions
Indicators include
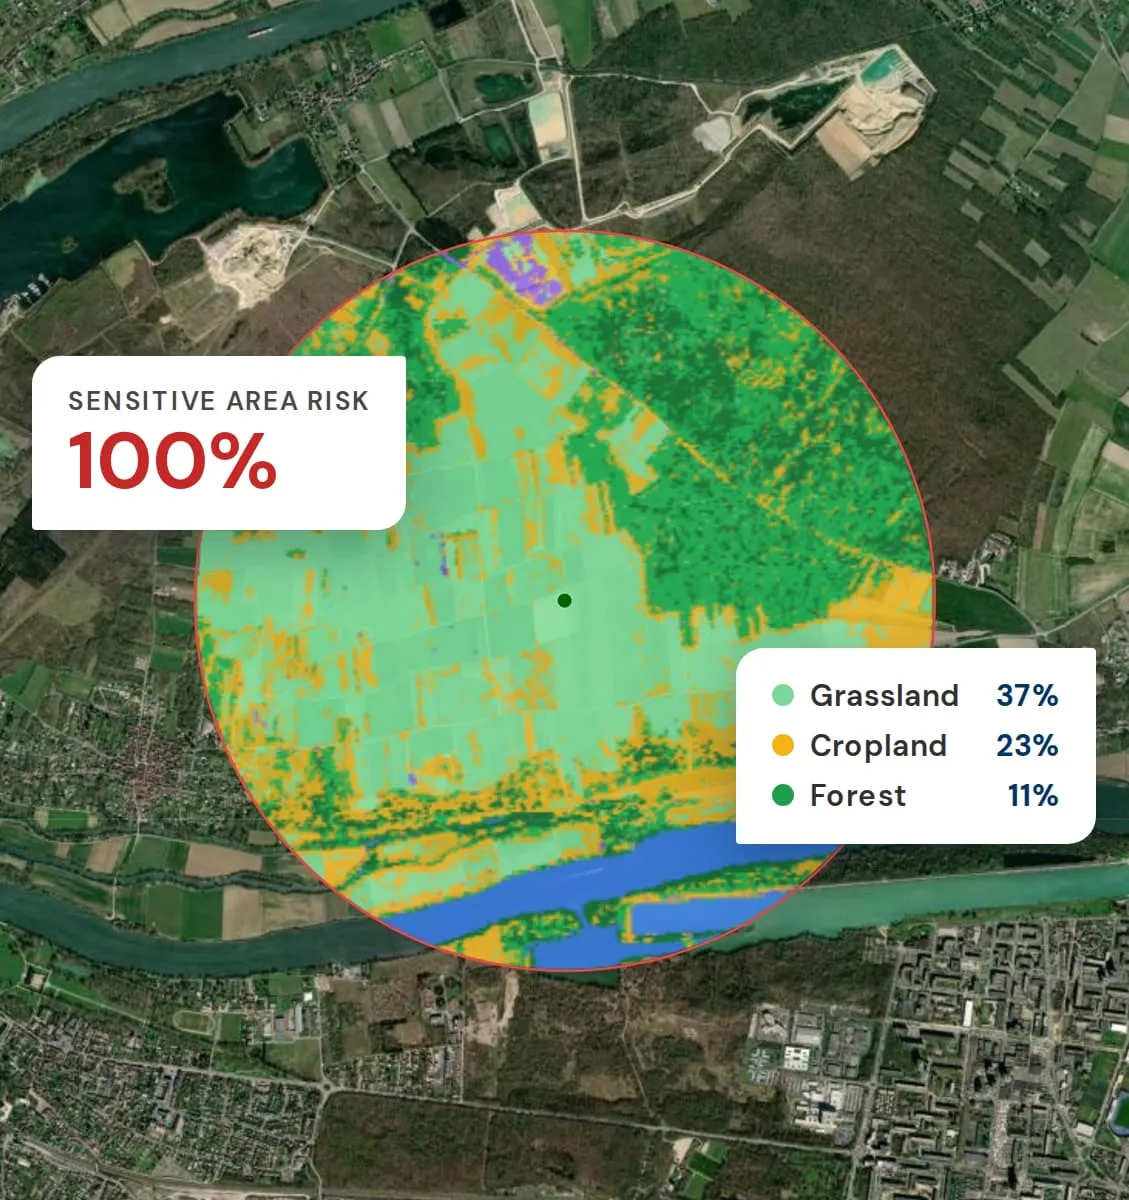
Sensitive areas
Proximity to Natura 2000, protected areas, Key Biodiversity Areas, WDPA sites, etc.
Land use & ecosystems
Land cover classification, ecosystem type and condition, habitat status and pressure
Species
IUCN Red List species (critically endangered, endangered, vulnerable), invasive species, pollinator score
Activities
Impact score, dependencies on ecosystem services, habitats under pressure, species under pressure, pesticide risk
Reporting & dashboards
- Interactive dashboard with map view: visualise all sites colour-coded by risk level, drill down to individual site assessments
- Aggregated portfolio KPIs: consolidated view across all sites for group-level reporting
- Individual site report: detailed assessment per site with risk scores, land use analysis, ecosystem maps, species data and landscape context
- CSRD / TNFD / GRESB / CDP aligned data export for regulatory disclosure
- Benchmark across sites and site types within your portfolio
- Export to CSV for further analysis
From data to action
- Automated site ranking to identify where to act first — based on multiple risk indicators
- Actionable biodiversity data to guide field decisions directly: locate invasive species to eradicate, identify habitats under pressure, target restoration efforts — without waiting for on-site monitoring
- Resource allocation guidance: focus field teams and budgets on highest-impact locations
- Decision-support for deploying complementary monitoring (BeeOmonitoring, BeeOtel, BeeOsoil) where ground-truth data would add the most value
The process
Simple. Scalable. Science-based.
Upload your sites
Provide GPS coordinates for all your sites — 10 or 6,000+. Define your activity type (NACE code) and radius of analysis.
Automated analysis
The platform automatically collects satellite imagery and cross-references environmental databases to assess indicators such as land use, sensitive areas, ecosystem condition, species status, habitat pressure and activity impacts for each site.
Prioritise & understand
Sites are ranked by risk level. Visualise results on your dashboard, drill into individual site assessments to understand the state of local biodiversity, and export ESRS E4-aligned KPIs for reporting.
Act on your data
Use the data to take direct field actions — eradicate invasive species, restore habitats under pressure, target pollution sources. For sites that need deeper insight, deploy on-site monitoring (BeeOmonitoring, BeeOtel, BeeOsoil). Track and manage your action plan with BeeOinitiative.
Who uses BeeOimpact
Designed for organisations managing multiple sites.
Industry & Infrastructure
Multi-site impact assessment & prioritisation
Assess biodiversity risk across all your industrial sites at once. Identify which locations are closest to sensitive ecosystems, understand your impact and dependencies, then take targeted action where it matters most.
Agri-food & Water
Supply chain & sourcing area prioritisation
Map environmental risk across sourcing territories and water catchments. Identify pesticide pressure, invasive species and habitats under threat. Prioritise areas for regenerative agriculture, pollution reduction or stakeholder engagement based on data, not assumptions.
Real Estate & Cities
Portfolio-level biodiversity screening
Screen your entire real estate portfolio for biodiversity risk, proximity to sensitive areas and state of local ecosystems. Support GRESB and CDP submissions and permitting with site-level environmental data at a fraction of the cost of traditional assessments.
Compliance & reporting
BeeOimpact data feeds directly into your regulatory reporting.
CSRD / ESRS E4
Biodiversity & ecosystems disclosure
TNFD
Nature-related financial disclosures
EU Taxonomy
Appendix 7 — sensitive areas
GRESB
Real estate & infrastructure
CDP
Biodiversity questionnaire
Complete your approach
BeeOimpact works best with…
Bee data · Landscape level · Biodiversity & pollution
BeeOmonitoring
Deploy on-site monitoring on your priority sites. Collect ground-truth data on plant biodiversity and agricultural or industrial pollutants at landscape scale.
Action platform · Site management
BeeOinitiative
Turn your prioritisation and field actions into a structured management plan. Define objectives, track progress, engage site managers and report on impact KPIs.
Strategy · Field expertise · All scales
BeeOconsult
Need help interpreting results or building your biodiversity strategy? Our experts turn BeeOimpact data into a roadmap aligned with CSRD, TNFD and your business objectives.