
Wild bee data · Parcel level · Biodiversity & pollution
BeeOtel
Wild bees as natural bioindicators. Assess plant biodiversity, pollinator presence and agricultural or industrial pollutants at parcel level — across 40 hectares (100 acres), with a patented nature-based device that requires no sensor infrastructure and no specialist intervention.
Why BeeOtel
Four reasons it creates business value.
What you get
Concrete outputs you can act on.
Data
Wild bee presence & diversity
Occupancy rate · Species group identification · Environmental quality indicator derived from bee presence
Plant biodiversity
Species richness · Dominant pollens · Native vs. exotic ratio · Detection of invasive alien species
Pesticides
516 active ingredients tested · Origin and impact analysis
Heavy metals
Lead · Cadmium · Zinc · Mercury · Arsenic · Copper · Chromium
Reporting & dashboards
- Full PDF monitoring report with analysis, interpretation and year-on-year comparison
- Online dashboard via BeeOapps: track KPIs over time, compare sites, export data
- Occupancy rate trends and correlation with biodiversity and pollution indicators
- CSRD / TNFD / SBTN aligned data export for regulatory disclosure
- Benchmark across sites using the same standardized protocol
Action plan
- Prioritized on-site recommendations from our biodiversity experts, based on monitoring findings
- Habitat improvement proposals: plant species to introduce, pollinator-friendly management practices
- Pollution reduction pathways based on source identification
- Stakeholder engagement plan: communication materials for employees, farmers, regulators or citizens
- Follow-up monitoring plan to track impact of actions over time
The process
Simple. Replicable. Science-based.
Install the BeeOtel
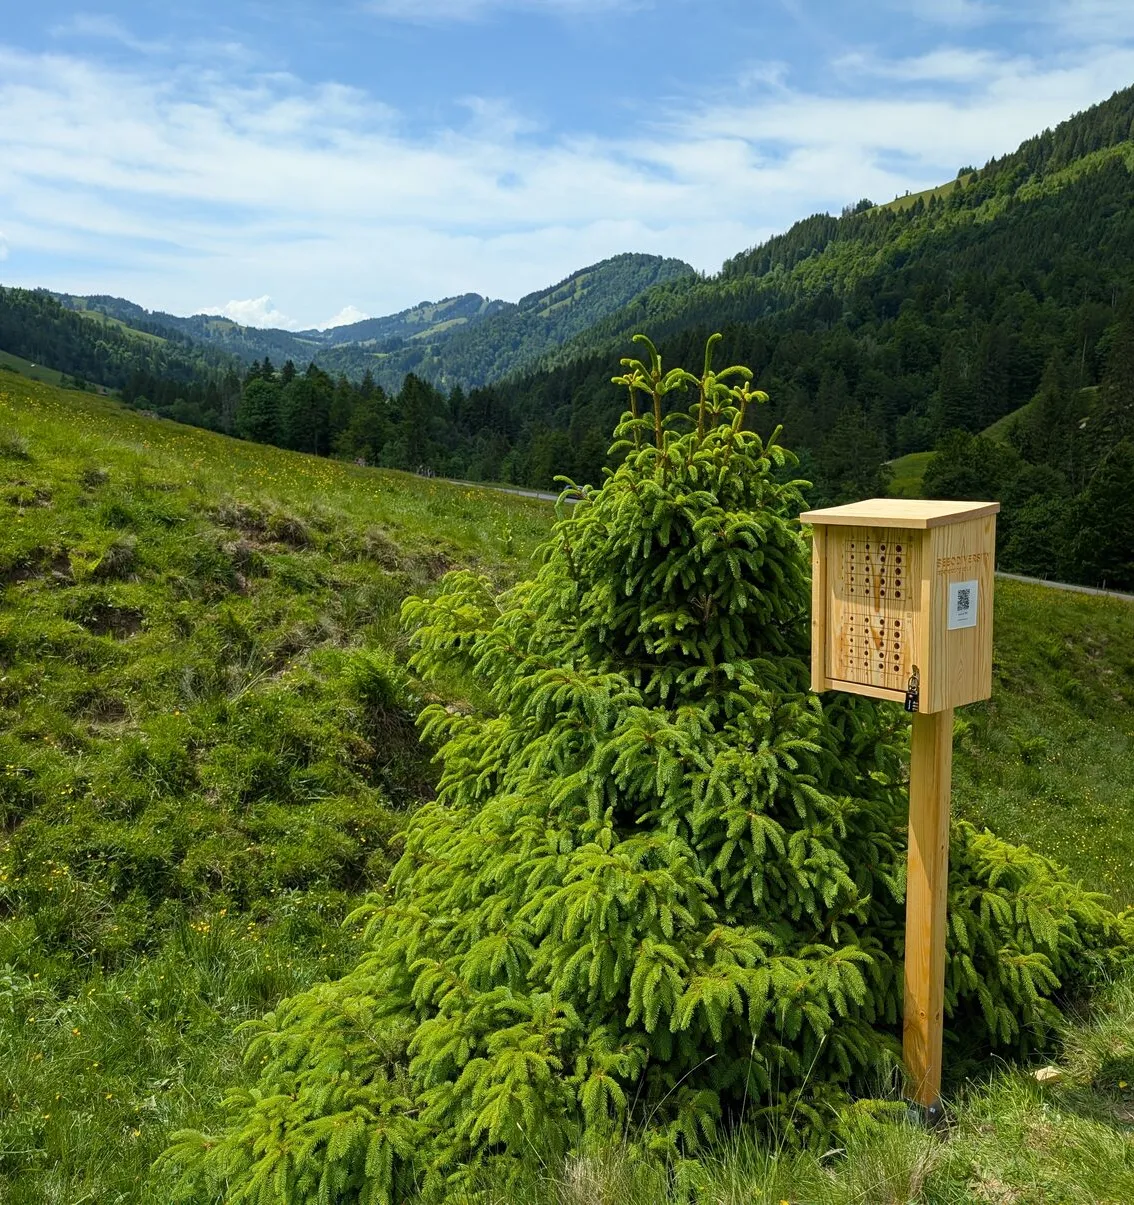
A wild bee hotel with standardized nesting tubes of different diameters is placed on or near your site. Each tube targets specific wild bee species groups. Installation takes minutes — no specialist required.
Photo monitoring — participatory science
Observers regularly photograph the BeeOtel using our BeeOtel app. Wild bees seal tubes after nesting with their own materials, allowing us to calculate occupancy rate and identify species groups — remotely and non-intrusively.
Pollen collection & lab analysis
Pollen is collected seasonally and analysed. DNA analysis identifies plant species, while chemical screening detects 516 pesticides, heavy metals and other pollutants.
Report & action plan
You receive your report, an access to the platform and a prioritized action plan from our expert team — including recommendations to enhance biodiversity and reduce pollution.
Who uses BeeOtel
Designed for organizations monitoring multiple sites or parcels.
Agri-food & Regenerative agriculture
Monitor the impact of farming practices on biodiversity and pollinators at parcel level. Compare conventional vs. regenerative parcels with standardized data.
Industry & Real estate
Assess the environmental quality of your sites at low cost. Deploy BeeOtels across your portfolio to identify priority sites for further analysis or action — and demonstrate positive impact to stakeholders.
Cities & Territorial actors
Monitor pollinator health and plant diversity across municipal green spaces. Engage citizens through participatory science and communicate progress with credible data.
Compliance & reporting
BeeOtel data feeds directly into your regulatory reporting.
CSRD / ESRS E4
Biodiversity & ecosystems disclosure
TNFD
Nature-related financial disclosures
SBTN
Science-based targets for nature
GRESB
Real estate & infrastructure
Go further — optional add-ons
Complement your BeeOtel monitoring with additional analyses.
Soil analysis
Quantification of pesticide and heavy metal concentrations in soil, plus DNA analysis of soil biodiversity providing valuable insights on soil functionality (retention, erosion, carbon sequestration,...).
Additional plant diversity analysis (eDNA)
DNA analysis of plant biodiversity collected in the field around the BeeOtel — providing data on plant richness, habitats, protected species and invasive species.
Air quality monitoring
Installation of a sensor for continuous measurement of temperature, relative humidity and air pollution levels (NO₂, NH₃, PM2.5 and PM10). Results integrated in the annual report.
Complete your approach
BeeOtel works best with…
Remote sensing · Multi-site
BeeOimpact
Prioritize which sites need on-site monitoring. Start with a global portfolio view before deploying BeeOtels.
Bee data · Landscape level · Biodiversity & pollution
BeeOmonitoring
Monitor at landscape scale (700 ha) with honeybees. Combine with BeeOtel for a multi-scale view — from ecosystem trends to parcel-level precision.
Soil health · Microbiome · Regenerative agriculture
BeeOsoil
Go below ground. Combine BeeOtel’s above-ground pollinator data with soil eDNA analysis for a complete picture of ecosystem functionality.