
Action management · Multi-site · Platform
BeeOinitiative
Your biodiversity action plan — in one platform. Define site-level objectives, select from +80 ready-to-use initiatives scored by impact and cost, track implementation across all your sites and report on progress with standardized KPIs.
Why BeeOinitiative
Four reasons it creates business value.
What you get
Concrete outputs you can act on.
Initiatives library
- 90 pre-built biodiversity actions organized by theme: habitat creation (grass strips, ecological ponds, hedgerows), species support (bird boxes, bird platforms, perches), invasive species management (curly waterweed removal), light pollution reduction, regenerative agriculture practices, green infrastructure, soil restoration, water stewardship and more.
- Each initiative includes: full description, biodiversity benefits, points of attention, step-by-step implementation guide, impact score (1–5 scale), cost estimate (€ to €€€€€) and recommended installation period (monthly calendar).
- Create custom initiatives tailored to your operations and upload them alongside the standard library.
Site-level management
- Each site gets its own dedicated page with: a map showing its location, the number of initiatives assigned and completed, total budget (spent vs. planned), and an overall biodiversity score in points.
- Browse the initiatives library directly from the site page. Plan an initiative by assigning it to the site with a target date and budget. Close it once completed.
- View planned and completed initiatives side by side, with dates, scores and costs for each.
Portfolio dashboard
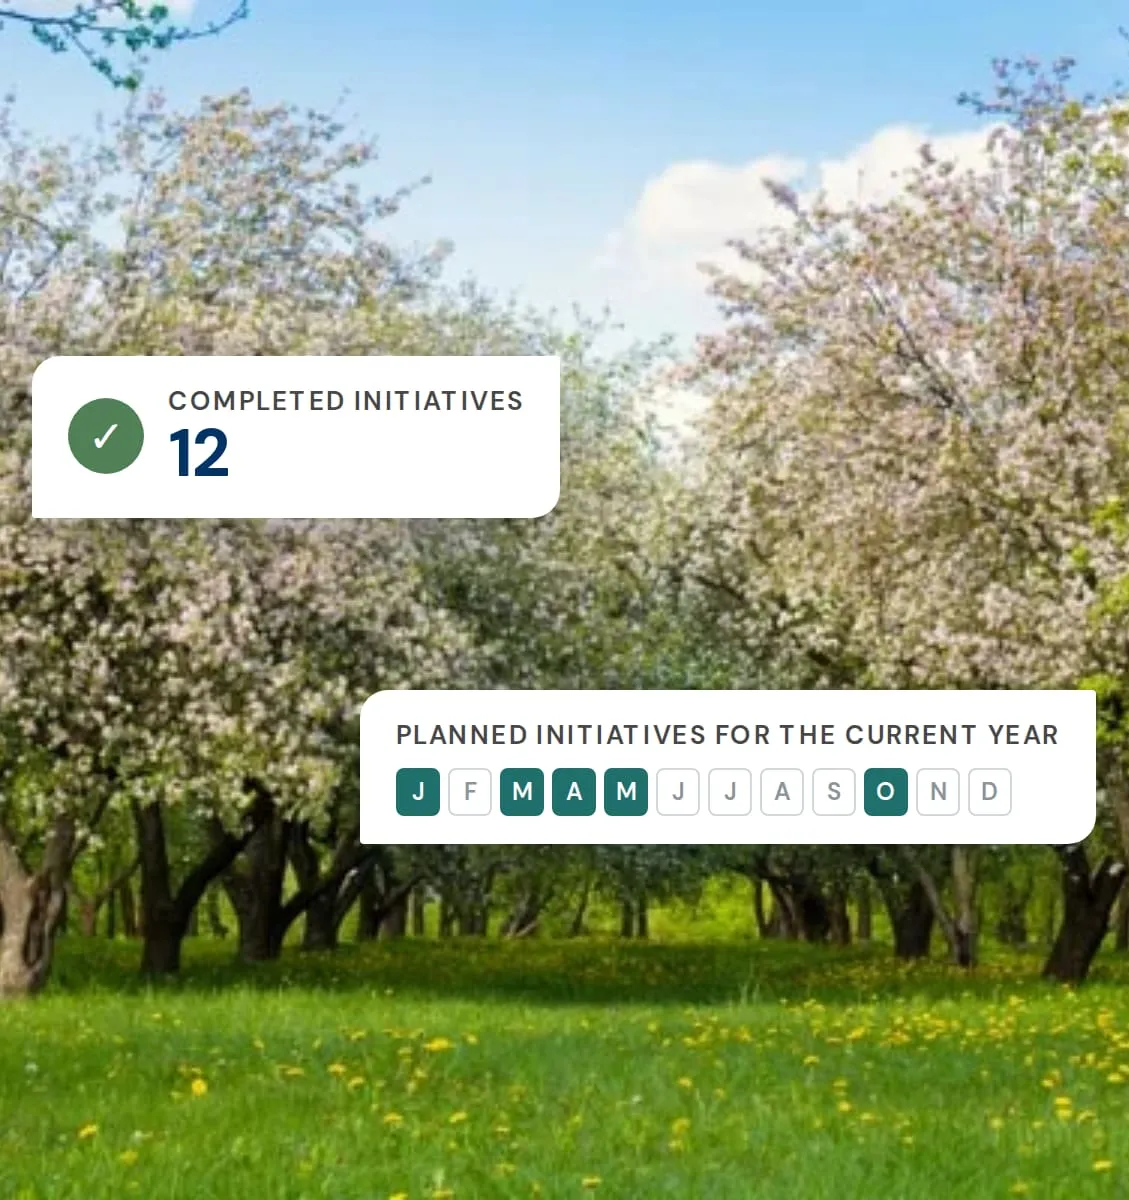
- Aggregated overview across all sites: total number of sites, completed initiatives, overall biodiversity score, percentage of active vs. inactive sites, and total budget spent vs. planned (with visual donut chart).
- Monthly calendar showing planned initiatives for the current year across all sites.
- Completed initiatives distribution: see how many sites have 0, 1–3 or more than 3 completed initiatives.
- Top-5 most active sites ranking to drive internal engagement between site managers.
Reporting
- Audit and history reports for all completed initiatives.
- Aggregated KPIs exportable for CSRD / ESRS E4 disclosure, TNFD reporting, SBTN alignment, GRESB submissions and label or certification applications.
- Audit-ready data trail: every action is timestamped, attributed to a site and a responsible person, and linked to a measurable score and budget.
- Coming soon: materiality analysis integration and full results export.
The process
Simple. Scalable. Structured.
Set objectives
Define your site-level and portfolio-level biodiversity targets — for example, a minimum number of initiatives per site per year, a total budget envelope, or a target biodiversity score.
Select initiatives
Browse the library of +80 initiatives. Each card shows a photo, impact rating (1–5), cost rating (€–€€€€€) and a detail page with benefits, points of attention and step-by-step implementation. Assign selected initiatives to each site with a target date and budget. You can also create your own.
Implement & track
Site managers follow the implementation steps and update progress directly in the platform. Each site dashboard shows initiatives in progress and completed, with budget spent vs. planned and a biodiversity score that accumulates as actions are closed.
Report & improve
Use the portfolio dashboard to visualize aggregated impact: total initiatives completed, active site ratio, budget usage, score distribution. Export KPIs for CSRD, TNFD or stakeholder reporting. Identify inactive sites that need attention and adjust your action plan.
Who uses BeeOinitiative
Designed for multi-site organizations that need structure and scale.
Agri-food & Beverage
Supply chain biodiversity programs
Coordinate regenerative agriculture and pollinator initiatives across sourcing regions. Assign site-specific actions — grass strips, hedgerows, pollinator habitats — track supplier engagement, costs and biodiversity scores in one place.
Real Estate & Infrastructure
On-site nature-based solutions
Manage biodiversity initiatives across your portfolio — green roofs, ecological ponds, bird boxes, light pollution reduction. Track biodiversity score and budget per asset. Report on biodiversity net gain for GRESB and ESG disclosure.
Industry & Extraction
Mitigation & restoration tracking
Document all mitigation and restoration actions per industrial site. Provide auditable evidence of positive impact for regulators, investors and communities. Monitor budget allocation and completion rates across operations.
Cities & Public Authorities
Municipal biodiversity management
Align landscaping and green infrastructure investments with measurable biodiversity outcomes. Engage citizens and communicate progress transparently. Use the top-5 ranking to drive engagement across municipal districts.
Compliance & reporting
BeeOinitiative data feeds directly into your regulatory reporting.
CSRD / ESRS E4
Biodiversity & ecosystems disclosure — action metrics and targets
TNFD
Nature-related financial disclosures — response and action metrics
SBTN
Science-based targets for nature — action tracking and progress
GRESB
Real estate & infrastructure — biodiversity management score
Labels & certifications
Documented evidence of on-site positive actions with auditable trail
Complete your approach
BeeOinitiative works best with…
Remote sensing · Multi-site
BeeOimpact
Prioritize which sites need action first. Use BeeOimpact’s remote assessment to identify high-risk locations, then deploy targeted initiatives through BeeOinitiative.
Bee data · Landscape level · Biodiversity & pollution
BeeOmonitoring
Measure the real impact of your initiatives at landscape scale. BeeOmonitoring provides the ground-truth data to verify whether your on-site actions are improving biodiversity and reducing pollution across 700 hectares / 1,800 acres.
Soil health · Microbiome · Regenerative agriculture
BeeOsoil
Assess whether your soil-related initiatives — regenerative agriculture, grass strips, cover crops — are actually improving soil biodiversity and functionality. BeeOsoil uses eDNA analysis to provide the evidence.