Pollution measurement that builds trust:
from perimeter monitoring to clear KPIs and compliant reporting

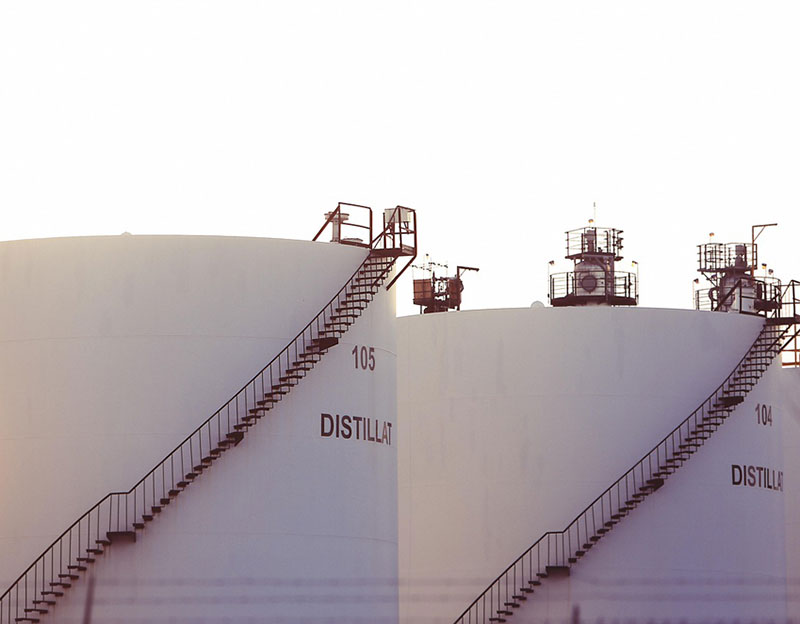
Credits Life of Pix
Industrial players in sectors like waste management, recycling, chemicals and pharmaceuticals operate in complex landscapes, often near wetlands, neighborhoods, farmland or protected areas.
In this context, they increasingly face a double challenge: prove they control emissions and keep communities informed in a way people actually trust.
The quickest way to get there is to combine landscape-scale monitoring around the site with targeted on-site sampling, publish simple KPIs (trends, hotspot maps), and report consistently under ESRS and TNFD, without drowning non-experts in jargon
Why perimeter and targeted sampling beats isolated spot checks
A territory-scale lens shows what really leaves, or does not leave, the site.
BeeOmonitoring relies on bees as natural samplers and analyzes pollen to detect and measure families such as heavy metals, PFAS, HAPs, dioxins and furans across a wide area around the apiaries. If nothing appears beyond the fence, you have defensible evidence that operations are not impacting surrounding ecosystems or nearby communities.

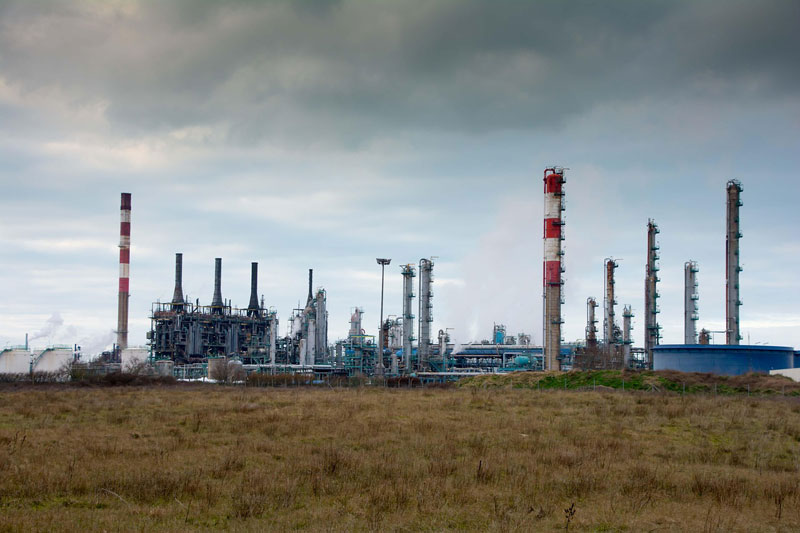
credits Fafar 59
Separate background from site-related signals
Repeated and continuous territory-scale measurements help separate background noise from site-related signals. You can distinguish traffic, legacy soils or other regional sources from issues plausibly linked to your activity. That clarity is essential for incident response, process improvement and transparent reporting.
This wide-area signal then guides where to look on site. By highlighting spatial patterns and seasons, you can direct on-site sampling to the right stack, process line, yard or drainage pathway. You save time and budget, and your diagnosis is sharper because ground checks are led by landscape clues rather than guesswork.
How transparent KPIs reduce complaints and focus mitigation
When residents and employees can see simple, comparable indicators, trust naturally goes up. So turning raw results into simple indicators is key to trust. A clear KPI set keeps experts and non-experts aligned.

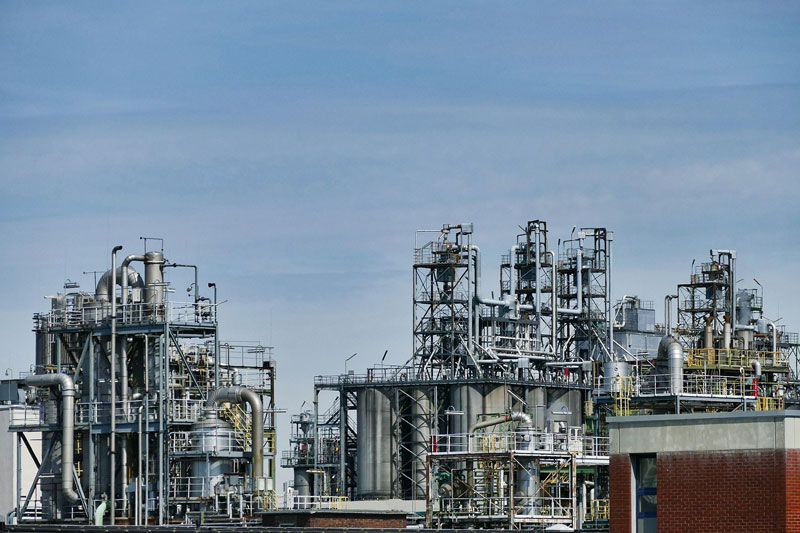
credits SatyaPrem
KPIs that everyone can read at a glance:
- trend lines by pollutant family, for example heavy metals, PFAS, HAPs, dioxins and furans, against a documented baseline
- hotspot maps that overlay results with BeeOimpact* layers on habitat sensitivity and proximity to sensitive zones
- exceedance flags tied to your internal thresholds and risk matrix
- distance-decay visuals that show whether signals diminish with distance from the site
With the same visuals shared internally and externally, neighbors and authorities see what you see. Complaints drop as explanations become evidence-based, and mitigation efforts concentrate where they deliver measurable reductions.
How to report consistently under ESRS E4 and TFND without losing non-experts
You can meet ESRS E4 and TNFD expectations while keeping messages plain.
A software solution such as BeeOimpact that browses large open-source datasets helps to provide a consistent view of habitat sensitivity and proximity to sensitive zones for each site, while BeeOmonitoring adds measured evidence of pressures and outcomes in the surrounding area.
Describe your monitoring plan, frequency, QA and lab methods once, then reuse the same description across sites to ensure comparability.
Metrics and targets you can reuse across sites
How emissions monitoring supports acceptance, permitting and innovation
Territory-scale evidence does more than detect problems. It helps prove the absence of negative impact when operations are well controlled. When the landscape shows stable background levels around the site, you can credibly demonstrate that the activity has no negative effect on the environment or on human health in the vicinity. That reduces concerns, eases dialogue in consultation bodies and strengthens the social license to operate.
Before-after evidence that accelerates permitting
Additional benefits of territory-scale monitoring in industrial contexts
Territory-scale monitoring offers earlier warning with fewer blind spots by revealing trends across a wide area before they escalate into complaints. It also drives smarter investments, because abatement can be targeted where the landscape actually shows a signal. With repeatable methods and comparable KPIs across sites and years, traceability for audits and disclosures becomes stronger and more defensible. Finally, it supports fairer accountability by distinguishing background sources from site-related signals and focusing actions where they matter most.

credits Tasukaran
How BeeOdiversity can help?
BeeOdiversity combines territory-scale evidence with clear decision support.
BeeOmonitoring uses bees as natural samplers to analyze pollen and track families of pollutants such as heavy metals, PFAS, HAPs, dioxins, furans etc. across around 700 hectares, revealing trends and potential hotspots beyond the site boundary.
In parallel, BeeOimpact maps habitat sensitivity and proximity to sensitive zones to place results in their environmental context, helping you prioritize sites, target on-site verification and abatement where it matters, and report consistently to stakeholders.
Together, these tools show what leaves, or does not leave, the site, support dialogue with communities and authorities, and provide a defensible baseline for ESRS E4 and TNFD disclosures.
To change tomorrow, contact us today
Want to halt the loss of biodiversity and create value? Do you have an idea or do you want to find out more about our approach and our services ?
Complete the form below and we will get back to you as soon as possible.
Terms of service & General conditions of use
BeeOdiversity develops projects in several European countries, Switzerland and the United States. Its tools and services can be used the world over.
To contact us from Belgium and abroad : +32 2 428 00 82
Head office :
Avenue Arnaud Fraiteur 15-23
1050 Brussels, Belgium
0 Comments