
Bee data · Landscape level · Biodiversity & pollution
BeeOmonitoring
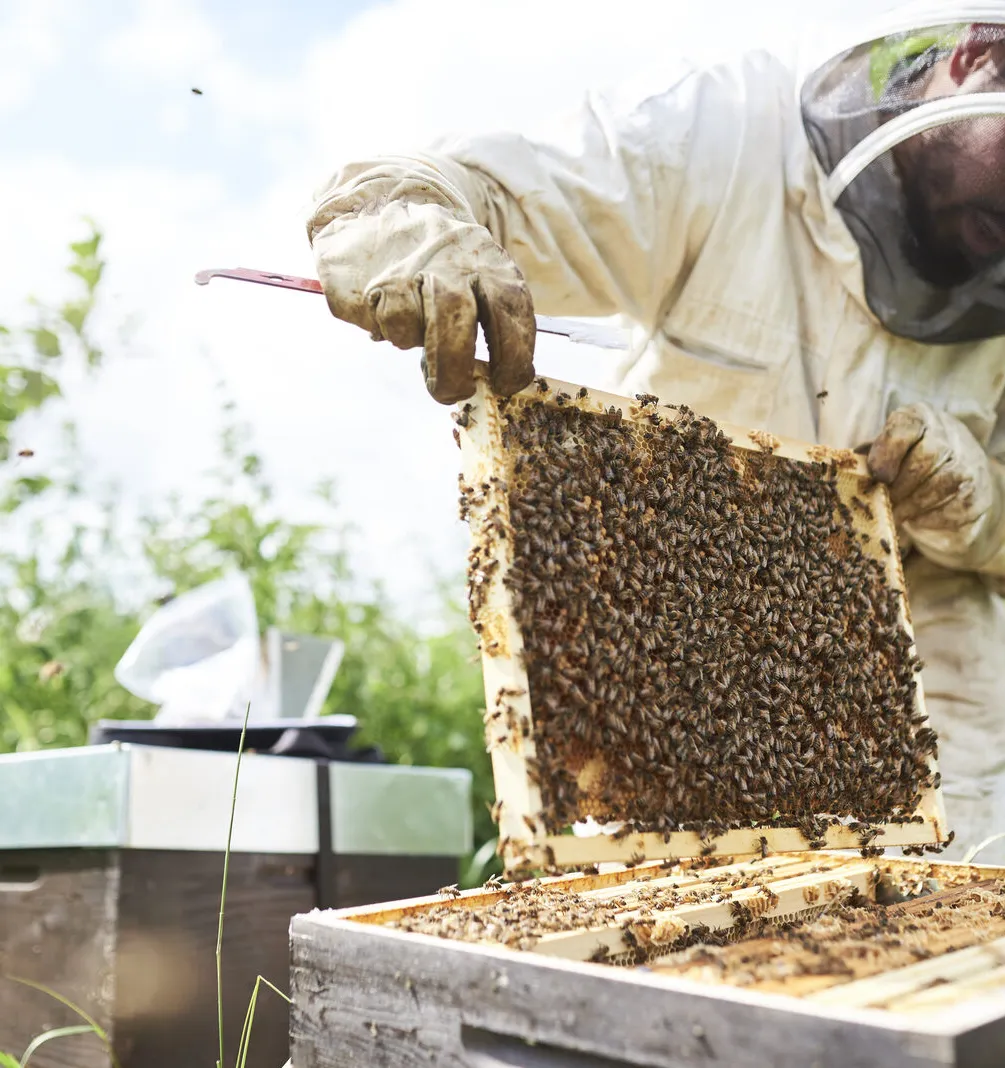
Bees as natural drones. Continuously monitor plant biodiversity — species richness, abundance, invasive species — along with related habitats, ecosystem health and agricultural or industrial pollutants across 700 hectares (1,800 acres), tracking change over time with no sensor infrastructure.
Why BeeOmonitoring
Four reasons it creates business value.
What you get
Concrete outputs you can act on.
Data
Plant diversity
Species richness · Plant quality index · Exotic vs. native ratio
Pesticides
Herbicides · Fungicides · Insecticides · 500+ active substances
Heavy metals
Lead · Cadmium · Zinc · Copper · Arsenic · Chrome
9 metals total
Emerging pollutants
PFAS · PAHs · Nitrates
Reporting & dashboards
- Full PDF monitoring report with all indicators, trend analysis and year-on-year comparison
- Online dashboard in BeeOinitiative: track KPIs over time, compare sites, export data
- Geo-referenced pollution map: identify origin of contamination by sector of the territory
- CSRD / TNFD / SBTN aligned data export for regulatory disclosure
- Benchmark against previous campaigns and against similar site types
Action plan
- Prioritized on-site recommendations from our agronomists and bioengineers, based on monitoring findings
- Habitat improvement proposals: plant species to introduce, management practices to adopt
- Pollution reduction roadmap: source identification and mitigation pathways
- Stakeholder engagement plan: communication materials for farmers, employees, regulators or citizens
- Follow-up monitoring plan to track impact of actions over time
The process
Simple. Scalable. Science-based.
Bees on-site
Local bee colonies are placed on or near your site. A local beekeeper is trained to implement the protocol.
Pollen collection
Bees collect pollen samples continuously across the full territory. We provide patented collection equipment to ensure data quality and reproducibility.
Lab analysis
Certified laboratory identifies plant species and screens for pesticides, heavy metals, PFAS, PAHs, VOCs and other pollutants.
Report & action plan
You receive your report, an access to the platform and a prioritized action plan from our expert team — including recommendations to enhance biodiversity and reduce pollution.
Who uses BeeOmonitoring
Designed for organizations with complex land footprints.
Agri-food & Water
Water catchment protection
Monitor pesticide pressure across a water source territory. Engage suppliers and farmers with hard data.
Industry & Infrastructure
Industrial site impact monitoring
Measure your industrial site’s impact on surrounding biodiversity. Document baseline for CSRD disclosure and permit applications.
Cities & Territories
Municipal green space monitoring
Assess the effectiveness of your green infrastructure. Communicate progress to citizens with credible, independent data.
Compliance & reporting
BeeOmonitoring data feeds directly into your regulatory reporting.
CSRD / ESRS E4
Biodiversity & ecosystems disclosure
TNFD
Nature-related financial disclosures
SBTN
Science-based targets for nature
GRESB
Real estate & infrastructure
Complete your approach
BeeOmonitoring works best with…
Remote sensing · Multi-site
BeeOimpact
Prioritize which sites need on-site monitoring. Start with a global portfolio view before deploying hives.
Wild bees · Biodiversity & pollution
BeeOtel
Go deeper at parcel level with wild bee monitoring. Complementary to BeeOmonitoring for precise on-site analysis.
Strategy · Field expertise · All scales
BeeOconsult
Turn your monitoring data into a full biodiversity strategy. Our experts build the roadmap aligned with CSRD and TNFD.