
6 Things to Check When Mapping Your Sites for Biodiversity Risk

Credits piviso
1. Proximity to sensitive areas
This spatial distance matters. A site located right next to a protected area does not carry the same risk profile as one located further away, especially since no site is ever truly isolated from its surroundings: it operates within a living landscape. That is why even small differences in proximity can significantly change ecological relevance and prioritization.

Credits: Natura 2000
2. Presence of priority or endangered species
These species are already under significant pressure from habitat loss, fragmentation, invasive species, or land-use change. So when they are present near your operations, even seemingly low-impact activities can become relevant in terms of cumulative stress on local populations.
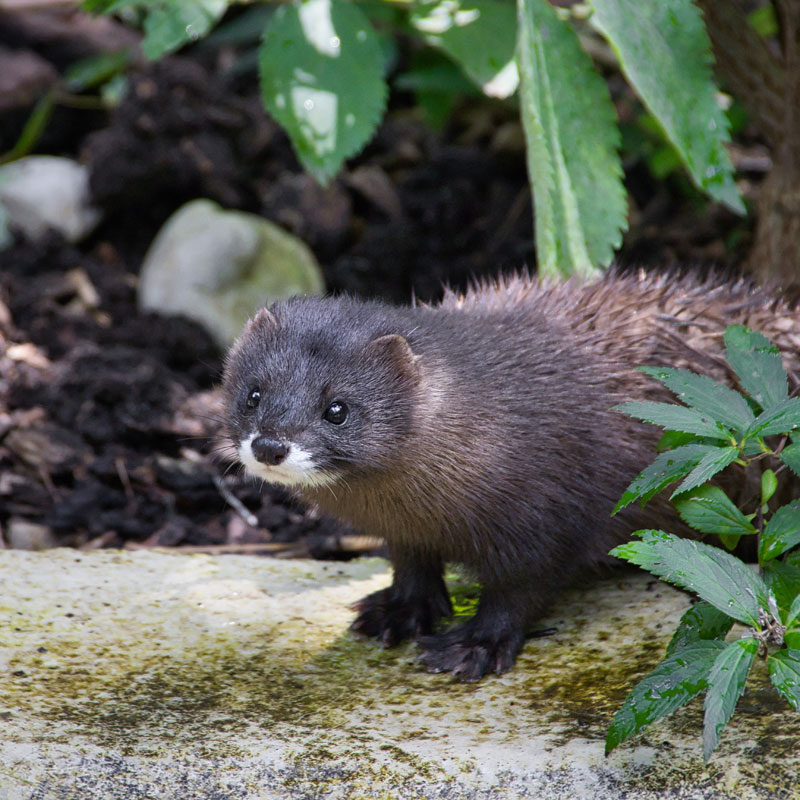
Credits: PoldyChromos, European mink is critically endangered in Europe.
3. Defining your area of influence
For low-intensity sites such as offices, the ecological influence may indeed be very limited. But for activities such as construction, mining, industrial production, or large infrastructure projects, that influence can extend several kilometers beyond the site boundary, due to noise, changes in water flow, land disturbance, dust, or habitat fragmentation.
This matters because it directly determines which species, habitats, and pressures you are actually interacting with. A definition of influence that is too narrow will underestimate risk, while a realistic one can significantly change prioritization outcomes. Being honest and consistent in defining this radius is therefore essential: it shapes how sites are scored, and how biodiversity risks are understood in practice.
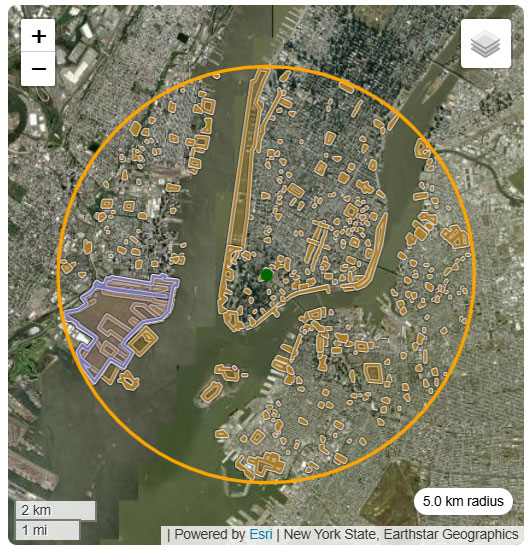
Credits: BeeOimpact tool by BeeOdiversity showing the area of influence for a demo site and its surrounding habitats.
4. Overlap between site activities and ecological pressures
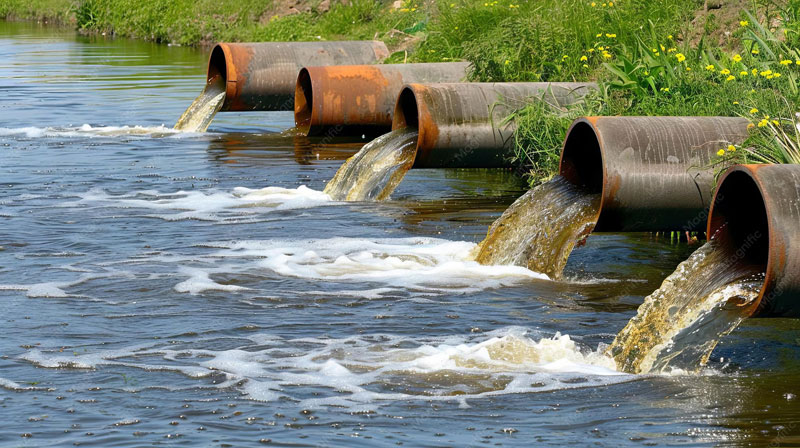
This is where spatial biodiversity data becomes powerful. It helps connect activities to ecological consequences, not just to locations.
Credits: freepik.com
5. Connectivity and fragmentation of surrounding habitat
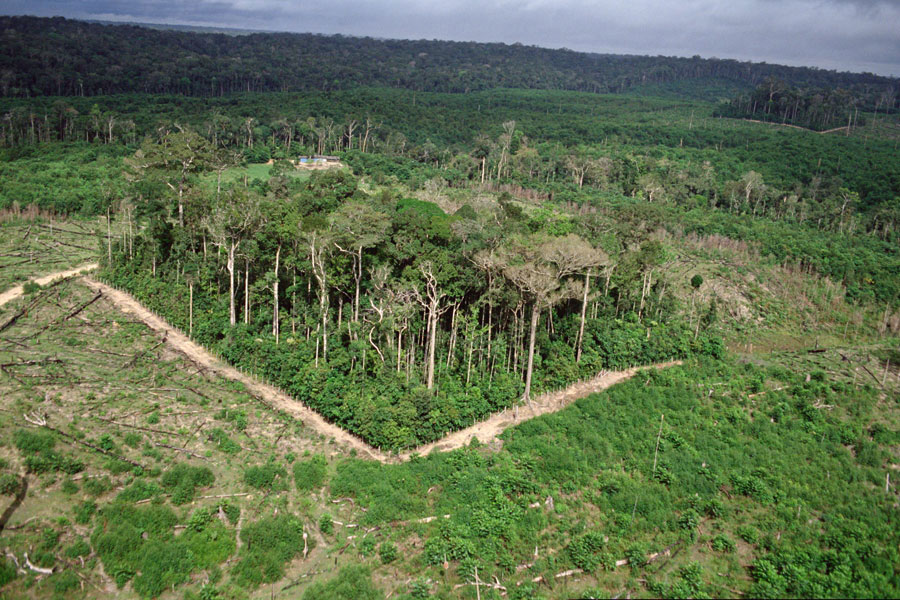
These indicators help reveal whether the landscape is connected or fragmented: whether suitable habitats appear as continuous areas, or as isolated patches scattered across the landscape. From a pollinator perspective, this directly affects movement, nesting potential, and species presence. In a highly fragmented landscape, species have a lower capacity to move through the area and reach your site; in more connected landscapes, species can disperse more easily, which also changes how a site can contribute to ecological continuity.
Credits: animalia-life.club
6. Cumulative environmental pressure
For example, in areas with high pesticide use or intensive land management, local ecosystems are already operating under pressure. This can amplify the sensitivity of nearby biodiversity and reduce ecosystem resilience. In practice, you can only go so far by adding ecological value on your own site if the surrounding pressures remain high, which is why collaboration with local stakeholders can become just as important as on-site action.
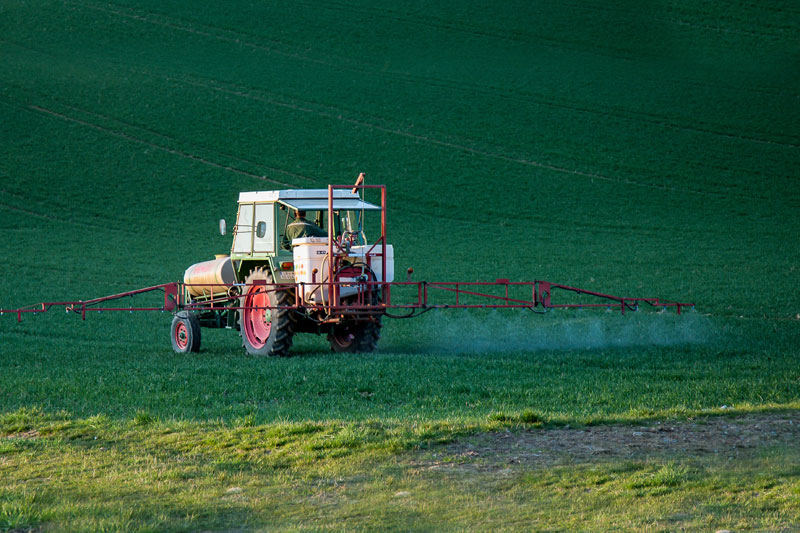
Credits: Maxmann
Turning location data into action
Getting the location right is the first step. Everything else, from risk scoring to nature strategy, follows from it.
Do you need support with your biodiversity strategy, or with assessing your own location-specific data? BeeOdiversity is here to help!
How BeeOdiversity can help
Whether you are preparing an ESRS E4 materiality assessment, mapping risks for CSDDD, or responding to requests from clients and investors in your value chain, the starting point is the same: site-level evidence.
BeeOdiversity combines strategic support and monitoring solutions (remote sensing & ground-level monitoring) to build robust biodiversity baselines that are quantitative, location-based, and traceable over time. We operate worldwide in all sectors.
Get in touch to find out how we can support your reporting, your risk assessment, or your first biodiversity baseline.
Fill in the form an we will get back to you soon.
BeeOdiversity develops projects in several European countries, Switzerland and the United States. Its tools and services can be used the world over.
To contact us from Belgium and abroad : +32 2 428 00 82
Head office :
Avenue Arnaud Fraiteur 15-23
1050 Brussels, Belgium
Like the idea of working with us ?



0 Comments